NEW! GoJS version 1.7: read about the new features and changes here
GoJS is a feature-rich JavaScript library for implementing custom interactive diagrams and complex visualizations across modern web browsers and platforms. GoJS makes constructing JavaScript diagrams of complex nodes, links, and groups easy with customizable templates and layouts.
GoJS offers many advanced features for user interactivity such as drag-and-drop, copy-and-paste, in-place text editing, tooltips, context menus, automatic layouts, templates, data binding and models, transactional state and undo management, palettes, overviews, event handlers, commands, and an extensible tool system for custom operations.
GoJS is pure JavaScript, so users get interactivity without requiring round-trips to servers and without plugins. GoJS normally runs completely in the browser, rendering to an HTML5 Canvas element or SVG without any server-side requirements. GoJS does not depend on any JavaScript libraries or frameworks, so it should work with any HTML or JavaScript framework or with no framework at all.
Build custom modeling environments and domain-specific visual languages using the powerful features of GoJS. Provide both a system editor and a read-only status monitor using shared code and templates. Simultaneously show alternative visualizations of the same data in different diagrams. Implement drill-down using expansion of subtrees and subgraphs or a detailed view in another diagram.
Yet GoJS is remarkably simple for such a powerful and flexible system. Many pages of documentation introduce the basic concepts and demonstrate typical features that most apps want to offer. Nodes and links can be arbitrarily detailed according to the needs of the application. The API consists of only a few dozen important classes which encapsulate many useful features that interact with each other. There are many properties that permit simple customizations; some methods may be overridden for more complicated customizations.
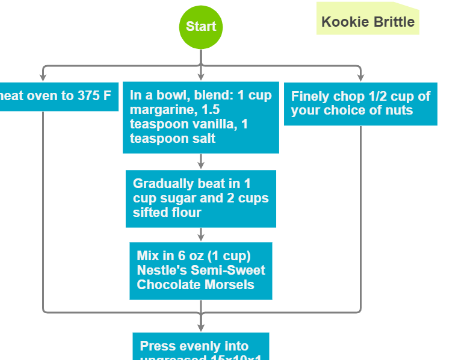
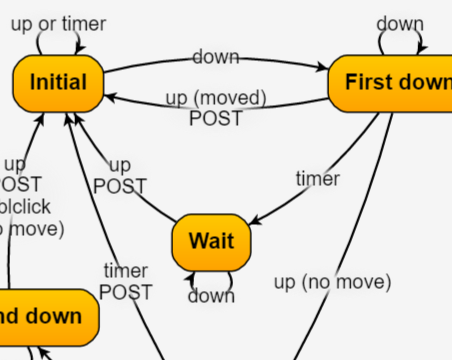
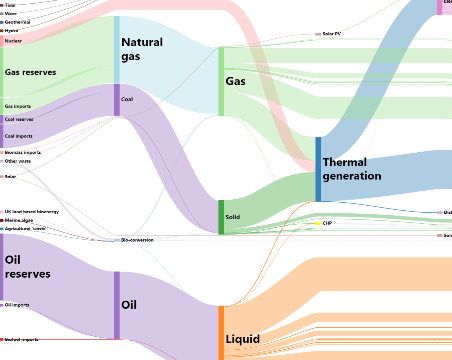
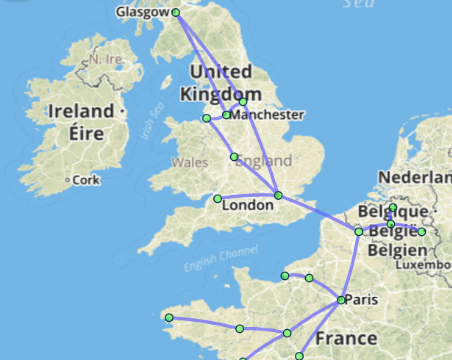
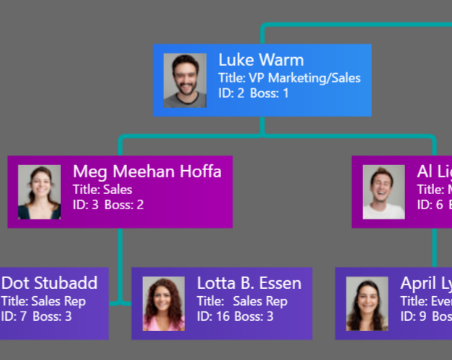
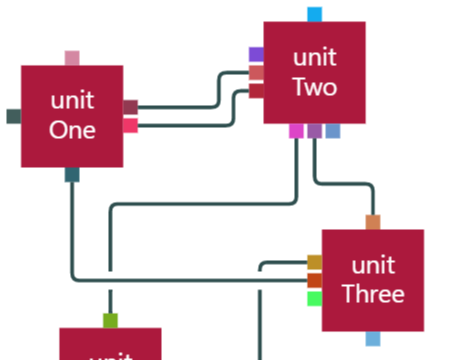
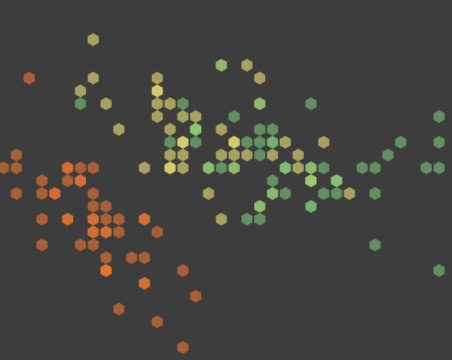
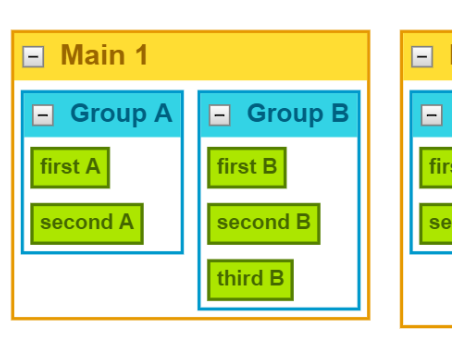
Run over 175 sample apps that are flowcharts, org charts, mind maps, UML diagrams, BPMN diagrams, graph editors, data visualization, and much more.
Get started with a step-by-step description of how to build a JavaScript diagram in HTML using GoJS and some model data.
Get a copy of the library and all of the samples, extensions, and documentation. Search the JavaScript code and modify the samples to start your app.
Read our introduction for a overview of GoJS concepts and features, including hundreds of live interactive examples embedded right in each page.
Evaluate the full library without any limitations. Register with us and get free support for a month to help build your app.
Read our comprehensive documentation for an in-depth reference of the properties and methods of all of the JavaScript classes.
When upgrading to a newer version, please read the Change Log.
You can explore the newest features and samples in the GoJS Beta for the next version, if a next version is available. Read the beta change log for the new features. Please note that our GitHub directory does not have the beta files.